

Allen's 데이터 맛집
[머신러닝] 회귀 : 집 값 예측 본문
집 값 예측 Description.
You have some experience with R or Python and machine learning basics. This is a perfect competition for data science students who have completed an online course in machine learning and are looking to expand their skill set before trying a featured competition.
💡Getting Started Notebook
To get started quickly, feel free to take advantage of this starter notebook.
Competition Description

Ask a home buyer to describe their dream house, and they probably won't begin with the height of the basement ceiling or the proximity to an east-west railroad. But this playground competition's dataset proves that much more influences price negotiations than the number of bedrooms or a white-picket fence.
With 79 explanatory variables describing (almost) every aspect of residential homes in Ames, Iowa, this competition challenges you to predict the final price of each home.
Practice Skills
- Creative feature engineering
- Advanced regression techniques like random forest and gradient boosting
Acknowledgments
The Ames Housing dataset was compiled by Dean De Cock for use in data science education. It's an incredible alternative for data scientists looking for a modernized and expanded version of the often cited Boston Housing dataset.
Photo by Tom Thain on Unsplash.
Goal
It is your job to predict the sales price for each house. For each Id in the test set, you must predict the value of the SalePrice variable.
Metric
Submissions are evaluated on Root-Mean-Squared-Error (RMSE) between the logarithm of the predicted value and the logarithm of the observed sales price. (Taking logs means that errors in predicting expensive houses and cheap houses will affect the result equally.)
Submission File Format
The file should contain a header and have the following format:
Id,SalePrice
1461,169000.1
1462,187724.1233
1463,175221
etc.
You can download an example submission file (sample_submission.csv) on the Data page.
- 예측할 변수 ['SalePrice']
- 평가: rmse, r2
- rmse는 낮을 수록 좋은 성능
- r2는 높을 수록 좋은 성능
라이브러리 및 데이터 불러오기
데이터를 불러오고 예측을 해야 되는 y_train의 데이터를 출력하여 확인해 봅니다.
# 시험환경 세팅 (코드 변경 X)
import pandas as pd
import numpy as np
from sklearn.model_selection import train_test_split

def exam_data_load(df, target, id_name="", null_name=""):
    if id_name == "":
        df = df.reset_index().rename(columns={"index": "id"})
        id_name = 'id'
    else:
        id_name = id_name

    if null_name != "":
        df[df == null_name] = np.nan

    X_train, X_test = train_test_split(df, test_size=0.2, shuffle=True, random_state=2021)
    y_train = X_train[[id_name, target]]
    X_train = X_train.drop(columns=[id_name, target])
    y_test = X_test[[id_name, target]]
    X_test = X_test.drop(columns=[id_name, target])
    return X_train, X_test, y_train, y_test

df = pd.read_csv("../input/house-prices-advanced-regression-techniques/train.csv")
X_train, X_test, y_train, y_test = exam_data_load(df, target='SalePrice', id_name='Id')

X_train.shape, X_test.shape, y_train.shape, y_test.shape
y_train
EDA
분석에 쓰일 X_train 데이터와 X_test 데이터를 shape과 데이터를 확인해 봅니다.
hist 막대그래프를 사용하여 SalePrice의 데이터 형태 및 분포도를 확인해 봅니다.
X_train.shape, X_test.shape

pd.set_option("display.max_columns", 100)
display(X_train.head(3))
display(X_test.head(3))
>>> ((1168, 79), (292, 79))


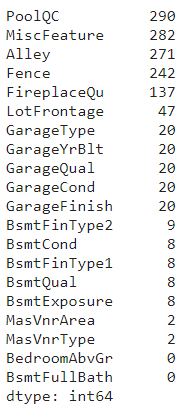
데이터의 info()와 결측치를 확인합니다.
X_train.isnull().sum().sort_values(ascending=False)[:20]

X_test.isnull().sum().sort_values(ascending=False)[:20]

X_train.info()

데이터 전처리
X_train 및 X_test에서 'object' 타입의 열(특성)을 제외한 열을 선택합니다.
y_train 데이터프레임에서 'SalePrice' 열을 target 변수에 저장합니다. 이 열은 우리가 예측하려는 대상(목표) 값입니다.
X_train 데이터프레임의 처음 3개 행을 확인하여 데이터의 일부를 출력합니다.
sklearn 라이브러리의 SimpleImputer 클래스를 사용하여 누락된 데이터를 처리합니다. 이 클래스는 누락된 값을 대체하는 데 사용됩니다.
SimpleImputer 객체 imp를 생성합니다.
X_train 데이터프레임에서 imp를 사용하여 누락된 값을 대체합니다. fit_transform 메서드를 사용하여 X_train의 누락된 값을 대체하고 결과를 X_train에 다시 할당합니다.
X_test 데이터프레임에서도 마찬가지로 imp를 사용하여 누락된 값을 대체합니다. 단, fit_transform 대신 transform 메서드를 사용합니다.
이 코드는 주로 머신 러닝 모델을 학습시키기 전에 데이터를 다룰 때 사용됩니다. 누락된 데이터를 처리하고, 문자열 형식의 열을 숫자로 바꾸는 등의 작업을 수행하여 데이터를 모델에 입력 가능한 형태로 만듭니다.
X_train = X_train.select_dtypes(exclude=['object'])
X_test = X_test.select_dtypes(exclude=['object'])
target = y_train['SalePrice']

X_train.head(3)

from sklearn.impute import SimpleImputer

imp = SimpleImputer()
X_train = imp.fit_transform(X_train)
X_test = imp.transform(X_test)

모델 생성 및 학습
모델 생성 및 학습을 위해 라이브러리를 불러오고 평가지표인 rmse를 위해 함수를 만들어줍니다.
from sklearn.model_selection import train_test_split
X_tr, X_val, y_tr, y_val = train_test_split(X_train, target, test_size=0.15, random_state=2022)
X_tr.shape, X_val.shape, y_tr.shape, y_val.shape

from sklearn.metrics import mean_squared_error, r2_score

def rmse(y, y_pred):
    return np.sqrt(mean_squared_error(y, y_pred))

from sklearn.model_selection import train_test_split
from sklearn.ensemble import RandomForestRegressor
from xgboost import XGBRegressor
모델 XGBRegressor, RandomForestRegressor 두 개의 R2_socre와 RMSE 점수를 출력하여 비교합니다.
model = XGBRegressor()
model.fit(X_tr, y_tr, verbose=False)
pred = model.predict(X_val)

print("R2 : " + str(r2_score(y_val, pred)))
print("RMSE : " + str(rmse(y_val, pred)))

model = RandomForestRegressor()
model.fit(X_tr, y_tr)
pred = model.predict(X_val)

print("R2 : " + str(r2_score(y_val, pred)))
print("RMSE : " + str(rmse(y_val, pred)))
>>> R2 : 0.8534731687038711
>>> RMSE : 31827.55779287209
>>> R2 : 0.8439171918645161
>>> RMSE : 32849.0089469176
더 점수가 좋았던 XGBRegressor를 사용하여 predict값을 구하고 제출형태인 submission 데이터 프레임을 만들어 확인해 봅니다.
y = y_train['SalePrice']

final_model = XGBRegressor()
final_model.fit(X_train, y)

prediction = final_model.predict(X_test)

submission = pd.DataFrame(data={
    'Id': y_test.Id,
    'income' : prediction
})

submission.head()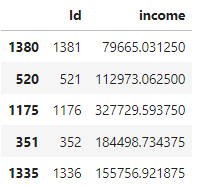
최종적으로 csv파일을 만들고 평가를 해봅니다.
submission.to_csv("12345.csv", index=False)

pred = model.predict(X_test)
print("RMSE : " + str(rmse(y_test['SalePrice'], prediction)))
print("R2 : " + str(r2_score(y_test['SalePrice'], prediction)))
>>> RMSE : 25308.81766179412
>>> R2 : 0.8902345949704513
케글출처 : https://www.kaggle.com/competitions/house-prices-advanced-regression-techniques


