
Allen's 데이터 맛집
[머신러닝] 분류 : 이직 여부 예측하기 본문
About Dataset
Context and Content
A company which is active in Big Data and Data Science wants to hire data scientists among people who successfully pass some courses which conduct by the company. Many people signup for their training. Company wants to know which of these candidates are really wants to work for the company after training or looking for a new employment because it helps to reduce the cost and time as well as the quality of training or planning the courses and categorization of candidates. Information related to demographics, education, experience are in hands from candidates signup and enrollment.
This dataset designed to understand the factors that lead a person to leave current job for HR researches too. By model(s) that uses the current credentials,demographics,experience data you will predict the probability of a candidate to look for a new job or will work for the company, as well as interpreting affected factors on employee decision.
The whole data divided to train and test . Target isn't included in test but the test target values data file is in hands for related tasks. A sample submission correspond to enrollee_id of test set provided too with columns : enrollee _id , target
Note:
- The dataset is imbalanced.
- Most features are categorical (Nominal, Ordinal, Binary), some with high cardinality.
- Missing imputation can be a part of your pipeline as well.
Features
- enrollee_id : Unique ID for candidate
- city: City code
- city_ development _index : Developement index of the city (scaled)
- gender: Gender of candidate
- relevent_experience: Relevant experience of candidate
- enrolled_university: Type of University course enrolled if any
- education_level: Education level of candidate
- major_discipline :Education major discipline of candidate
- experience: Candidate total experience in years
- company_size: No of employees in current employer's company
- company_type : Type of current employer
- last_new_job: Difference in years between previous job and current job
- training_hours: training hours completed
- target: 0 – Not looking for job change, 1 – Looking for a job change
Inspiration
- Predict the probability of a candidate will work for the company
- Interpret model(s) such a way that illustrate which features affect candidate decision
라이브러리 및 데이터 불러오기
데이터 분석을 위해 필요한 라이브러리와 데이터를 불러옵니다.
# This Python 3 environment comes with many helpful analytics libraries installed
# It is defined by the kaggle/python Docker image: https://github.com/kaggle/docker-python
# For example, here's several helpful packages to load

import numpy as np # linear algebra
import pandas as pd # data processing, CSV file I/O (e.g. pd.read_csv)

# Input data files are available in the read-only "../input/" directory
# For example, running this (by clicking run or pressing Shift+Enter) will list all files under the input directory

import os
for dirname, _, filenames in os.walk('/kaggle/input'):
    for filename in filenames:
        print(os.path.join(dirname, filename))

# You can write up to 20GB to the current directory (/kaggle/working/) that gets preserved as output when you create a version using "Save & Run All"
# You can also write temporary files to /kaggle/temp/, but they won't be saved outside of the current session

import pandas as pd

X_train = pd.read_csv("/kaggle/input/hr-data-predict-change-jobscompetition-form/X_train.csv")
y_train = pd.read_csv("/kaggle/input/hr-data-predict-change-jobscompetition-form/y_train.csv")
X_test= pd.read_csv("/kaggle/input/hr-data-predict-change-jobscompetition-form/X_test.csv")

y_test = pd.read_csv("/kaggle/input/hr-data-predict-change-jobscompetition-form/test_label/y_test.csv")

# X_train = pd.read_csv("https://raw.githubusercontent.com/Datamanim/datarepo/main/HRdata/X_train.csv")
# y_train = pd.read_csv("https://raw.githubusercontent.com/Datamanim/datarepo/main/HRdata/y_train.csv")
# X_test= pd.read_csv("https://raw.githubusercontent.com/Datamanim/datarepo/main/HRdata/X_test.csv")

# y_test = pd.read_csv("https://raw.githubusercontent.com/Datamanim/datarepo/main/HRdata/y_test.csv")
>>> /kaggle/input/hr-data-predict-change-jobscompetition-form/X_test.csv
>>> /kaggle/input/hr-data-predict-change-jobscompetition-form/y_train.csv
>>> /kaggle/input/hr-data-predict-change-jobscompetition-form/X_train.csv
>>> /kaggle/input/hr-data-predict-change-jobscompetition-form/test_label/y_test.csv
EDA
데이터 분석을 하기 위에 데이터를 파악하기 위해 데이터요약, 행/열 파악, 그리고 컬럼의 속성을 확인해 봅니다.
display(X_train.head())
display(y_train.head())

X_train.shape, X_test.shape, y_train.shape, y_test.shape

X_train.info()

>>> ((12452, 13), (6706, 13), (12452, 2), (6706, 2))

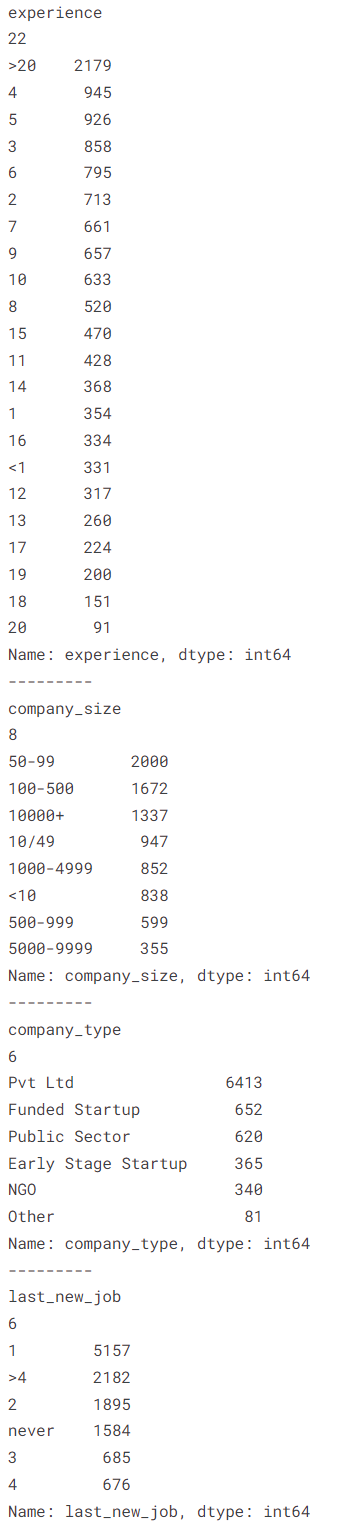
X_train의 모든 카테고리형 타입의 고유값 개수와 value_counts를 사용하여 개수를 확인합니다.
for col in X_train.select_dtypes(object).columns.tolist():
    print('---------')
    print(col)
    print(X_train[col].nunique())
    print(X_train[col].value_counts())
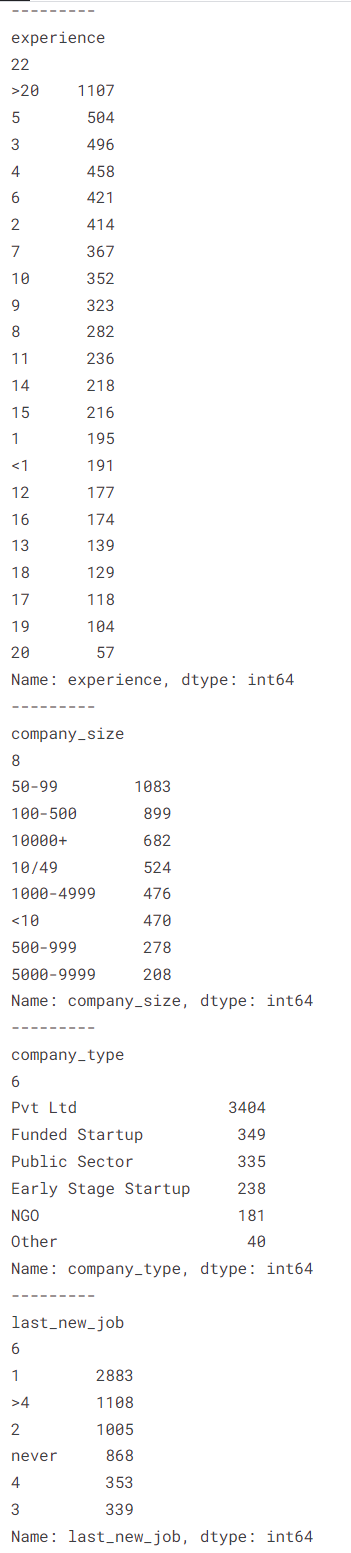
X_test의 모든 카테고리형 타입의 고유값 개수와 value_counts를 사용하여 개수를 확인합니다.
for col in X_test.select_dtypes(object).columns.tolist():
    print('---------')
    print(col)
    print(X_test[col].nunique())
    print(X_test[col].value_counts())

데이터 전처리
분석에 의미가 없는 "enrollee_id", "city" 컬럼을 제거합니다.
y_train에는 최종적으로 예측할 target 컬럼만 남겨둡니다.
y_train의 value_counts를 출력합니다.
X_train의 결측치 개수를 출력합니다.
X_test의 결측치 갯수를 출력합니다.
X_train = X_train.drop(["enrollee_id", "city"], axis=1)

X_test_id = X_test["enrollee_id"] # for submission
X_test = X_test.drop(["enrollee_id", "city"], axis=1)

y_train = y_train["target"]
print(y_train.value_counts())

print(X_train.isnull().sum())
print('---------')
print(X_test.isnull().sum())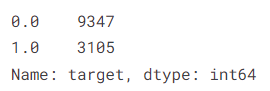

특정 값들로 결측치들을 대체하여 결측치 처리를 해줍니다.
gender -> other
enrolled_university -> no_enrollment
education_level -> Graduate(7540, Mode)
major_discipline -> STEM(9414, Mode)
experience -> <1
company_size -> <10
company_type -> Other
last_new_job -> never # 이전 직장과 현재 직장의 연도 차이
X_train['gender'] = X_train['gender'].fillna('Other')
X_test['gender'] = X_test['gender'].fillna('Other')

X_train['enrolled_university'] = X_train['enrolled_university'].fillna('no_enrollment')
X_test['enrolled_university'] = X_test['enrolled_university'].fillna('no_enrollment')

X_train['experience'] = X_train['experience'].fillna('<1')
X_test['experience'] = X_test['experience'].fillna('<1')

X_train['company_size'] = X_train['company_size'].fillna('<10')
X_test['company_size'] = X_test['company_size'].fillna('<10')

X_train['company_type'] = X_train['company_type'].fillna('other')
X_test['company_type'] = X_test['company_type'].fillna('other')

X_train['last_new_job'] = X_train['last_new_job'].fillna('never')
X_test['last_new_job'] = X_test['last_new_job'].fillna('never')

# fill mode

X_train['education_level'] = X_train['major_discipline'].fillna('Graduate')
X_test['education_level'] = X_test['major_discipline'].fillna('Graduate')

X_train['major_discipline'] = X_train['major_discipline'].fillna('STEM')
X_test['major_discipline'] = X_test['major_discipline'].fillna('STEM')

print(X_train.isnull().sum())
print('---------')
print(X_test.isnull().sum())
스케일링
c_cols = X_train.select_dtypes(object).columns
print(c_cols)

n_cols = X_train.select_dtypes(exclude="object").columns
print(n_cols)
# Scaling

from sklearn.preprocessing import StandardScaler

print("before scaling \n", X_train.head())
print('------------------')

n_cols = ['city_development_index', 'training_hours']

scaler = StandardScaler()
X_train[n_cols] = scaler.fit_transform(X_train[n_cols])
X_test[n_cols] = scaler.transform(X_test[n_cols])

print("after scaling \n ", X_train.head())
엔코딩을 진행합니다.
# Encoding

from sklearn.preprocessing import LabelEncoder

c_cols = ['gender', 'relevent_experience', 'enrolled_university',
       'education_level', 'major_discipline', 'experience', 'company_size',
       'company_type', 'last_new_job']

for col in c_cols :
    le = LabelEncoder()
    X_train[col] = le.fit_transform(X_train[col])
    X_test[col] = le.transform(X_test[col])

display(X_train.head())
print('---------')
display(X_test.head())
모델 학습 및 평가
모델 학습 데이터를 만들기 위해 데이터를 분할합니다.
from sklearn.model_selection import train_test_split
X_tr, X_val, y_tr, y_val = train_test_split(X_train, y_train, stratify=y_train, test_size = 0.2, random_state = 1)

print(X_tr.shape, X_val.shape, y_tr.shape, y_val.shape)
>>> (9961, 11) (2491, 11) (9961,) (2491,)
RandomForestClassifier, GradientBoostingClassifier, XGBClassifier 모델의 평가를 위해 선언을 해줍니다.
하이퍼 파라미터 튜닝을 위해 GrideSearchCV를 모든 모델에 적용 후 모델 이름, 가장 최적의 파라미터와 점수를 출력합니다.
from sklearn.ensemble import RandomForestClassifier, GradientBoostingClassifier
from xgboost import XGBClassifier

from sklearn.metrics import accuracy_score, roc_auc_score

rf = RandomForestClassifier(random_state=1)
gb = GradientBoostingClassifier(random_state=1)
xgb = XGBClassifier(random_state=1)

models = [rf, gb, xgb]

# Hyperparameter tuning

from sklearn.model_selection import GridSearchCV

params = {"n_estimators":[100,200,300,400,500], "max_depth":[1,2,3,4,5]}

# best_models = []

for model in models:
    gs = GridSearchCV(model, param_grid=params, cv = 5, scoring="roc_auc", n_jobs=4)
    gs.fit(X_tr, y_tr)

    print(f"="*10)
    print(f"model : {model}")
    print(f"params : {gs.best_params_}")
    print(f"score : {gs.best_score_}")
최적의 모델들로 accuracy 점수를 내봅니다.
# model_xgb
model_xgb = GradientBoostingClassifier(random_state=1, max_depth=2, n_estimators=200)
model_xgb.fit(X_tr, y_tr)

# model score : train
predict_tr_label = model_xgb.predict(X_tr)
predict_tr_proba = model_xgb.predict_proba(X_tr)[:, 1]

# model score : Validation
predict_val_label = model_xgb.predict(X_val)
predict_val_proba = model_xgb.predict_proba(X_val)[:, 1]


print('train accuracy :', accuracy_score(y_tr, predict_tr_label))
print('validation accuracy :', accuracy_score(y_val, predict_val_label))

print(f"="*10)

print('train auc :', roc_auc_score(y_tr, predict_tr_proba))
print('validation auc :', roc_auc_score(y_val, predict_val_proba))
>>> GradientBoostingClassifier(max_depth=2, n_estimators=200, random_state=1)
>>> train accuracy : 0.7997189037245257
>>> validation accuracy : 0.7844239261340827
>>> ==========
>>> train auc : 0.8177368191062361
>>> validation auc : 0.7758484245696522
최고로 좋은 점수를 받은 모델을 선정하여 예측 점수를 출력합니다.
# 최종 모델로 test data 최종 예측(평가)
test_predict = model_xgb.predict(X_test)
test_predict_prob = model_xgb.predict_proba(X_test)

print(f"accuracy_score:", accuracy_score(y_test["target"], test_predict))
print(f"roc_auc_score:", roc_auc_score(y_test["target"], test_predict_prob[:,1]))
>>> accuracy_score: 0.7854160453325381
>>> roc_auc_score: 0.795568127165894
최종 모델을 예측값(predict_proba)을 가지고 'enrollee_id'와 'target' 컬럼을 가진 데이터 프레임을 만들고 csv 파일을 생성합니다.
그리고 마지막 결과를 출력해 봅니다.
submit = pd.DataFrame({"enrollee_id": X_test_id, "target" : test_predict_prob[:,1]})
print(submit.head())

submit.to_csv("result_HR_data.csv", index = False)

check = pd.read_csv("result_HR_data.csv")
check.head()
케글출처 : https://www.kaggle.com/datasets/arashnic/hr-analytics-job-change-of-data-scientists


